graphid.util.mplutil module
- graphid.util.mplutil.multi_plot(xdata=None, ydata=[], **kwargs)[source]
plots multiple lines, bars, etc…
This is the big function that implements almost all of the heavy lifting in this file. Any function not using this should probably find a way to use it. It is pretty general and relatively clean.
- Parameters:
xdata (ndarray) – can also be a list of arrays
ydata (list or dict of ndarrays) – can also be a single array
**kwargs –
- Misc:
fnum, pnum, use_legend, legend_loc
- Labels:
xlabel, ylabel, title, figtitle ticksize, titlesize, legendsize, labelsize
- Grid:
gridlinewidth, gridlinestyle
- Ticks:
num_xticks, num_yticks, tickwidth, ticklength, ticksize
- Data:
xmin, xmax, ymin, ymax, spread_list # can append _list to any of these # these can be dictionaries if ydata was also a dict
- plot_kw_keys = [‘label’, ‘color’, ‘marker’, ‘markersize’,
‘markeredgewidth’, ‘linewidth’, ‘linestyle’]
any plot_kw key can be a scalar (corresponding to all ydatas), a list if ydata was specified as a list, or a dict if ydata was specified as a dict.
kind = [‘bar’, ‘plot’, …]
- if kind=’plot’:
spread
- if kind=’bar’:
stacked, width
References
matplotlib.org/examples/api/barchart_demo.html
Example
>>> xdata = [1, 2, 3, 4, 5]
>>> ydata_list = [[1, 2, 3, 4, 5], [3, 3, 3, 3, 3], [5, 4, np.nan, 2, 1], [4, 3, np.nan, 1, 0]]
>>> kwargs = {'label': ['spamΣ', 'eggs', 'jamµ', 'pram'],  'linestyle': '-'}
>>> #fig = multi_plot(xdata, ydata_list, title='$\phi_1(\\vec{x})$', xlabel='\nfds', **kwargs)
>>> fig = multi_plot(xdata, ydata_list, title='ΣΣΣµµµ', xlabel='\nfdsΣΣΣµµµ', **kwargs)
>>> show_if_requested()
Example
>>> fig1 = multi_plot([1, 2, 3], [4, 5, 6])
>>> fig2 = multi_plot([1, 2, 3], [4, 5, 6], fnum=4)
>>> show_if_requested()
- graphid.util.mplutil.figure(fnum=None, pnum=(1, 1, 1), title=None, figtitle=None, doclf=False, docla=False, projection=None, **kwargs)[source]
http://matplotlib.org/users/gridspec.html
- Parameters:
fnum (int) – fignum = figure number
pnum (int, str, or tuple(int, int, int)) – plotnum = plot tuple
title (str) – (default = None)
figtitle (None) – (default = None)
docla (bool) – (default = False)
doclf (bool) – (default = False)
- Returns:
fig
- Return type:
mpl.Figure
Example
>>> import matplotlib.pyplot as plt
>>> fnum = 1
>>> fig = figure(fnum, (2, 2, 1))
>>> plt.gca().text(0.5, 0.5, "ax1", va="center", ha="center")
>>> fig = figure(fnum, (2, 2, 2))
>>> plt.gca().text(0.5, 0.5, "ax2", va="center", ha="center")
>>> show_if_requested()
Example
>>> import matplotlib.pyplot as plt
>>> fnum = 1
>>> fig = figure(fnum, (2, 2, 1))
>>> plt.gca().text(0.5, 0.5, "ax1", va="center", ha="center")
>>> fig = figure(fnum, (2, 2, 2))
>>> plt.gca().text(0.5, 0.5, "ax2", va="center", ha="center")
>>> fig = figure(fnum, (2, 4, (1, slice(1, None))))
>>> plt.gca().text(0.5, 0.5, "ax3", va="center", ha="center")
>>> show_if_requested()
- graphid.util.mplutil.pandas_plot_matrix(df, rot=90, ax=None, grid=True, label=None, zerodiag=False, cmap='viridis', showvals=False, logscale=True)[source]
- graphid.util.mplutil.axes_extent(axs, pad=0.0)[source]
Get the full extent of a group of axes, including axes labels, tick labels, and titles.
- graphid.util.mplutil.adjust_subplots(left=None, right=None, bottom=None, top=None, wspace=None, hspace=None, fig=None)[source]
- Kwargs:
left (float): left side of the subplots of the figure right (float): right side of the subplots of the figure bottom (float): bottom of the subplots of the figure top (float): top of the subplots of the figure wspace (float): width reserved for blank space between subplots hspace (float): height reserved for blank space between subplots
- graphid.util.mplutil.dict_intersection(dict1, dict2)[source]
Key AND Value based dictionary intersection
- Parameters:
dict1 (dict)
dict2 (dict)
- Returns:
- Return type:
Example
>>> dict1 = {'a': 1, 'b': 2, 'c': 3, 'd': 4}
>>> dict2 = {'b': 2, 'c': 3, 'd': 5, 'e': 21, 'f': 42}
>>> mergedict_ = dict_intersection(dict1, dict2)
>>> print(ub.urepr(mergedict_, nl=0, sort=1))
{'b': 2, 'c': 3}
- graphid.util.mplutil._dark_background(ax=None, doubleit=False, force=False)[source]
- Parameters:
ax (None) – (default = None)
doubleit (bool) – (default = False)
CommandLine
python -m .draw_func2 --exec-_dark_background --show
Example
>>> # ENABLE_DOCTEST
>>> fig = figure()
>>> _dark_background()
>>> show_if_requested()
- graphid.util.mplutil._get_axis_xy_width_height(ax=None, xaug=0, yaug=0, waug=0, haug=0)[source]
gets geometry of a subplot
- graphid.util.mplutil.set_figtitle(figtitle, subtitle='', forcefignum=True, incanvas=True, size=None, fontfamily=None, fontweight=None, fig=None)[source]
- Parameters:
figtitle (?)
subtitle (str) – (default = ‘’)
forcefignum (bool) – (default = True)
incanvas (bool) – (default = True)
fontfamily (None) – (default = None)
fontweight (None) – (default = None)
size (None) – (default = None)
fig (None) – (default = None)
CommandLine
python -m .custom_figure set_figtitle --show
Example
>>> # DISABLE_DOCTEST
>>> fig = figure(fnum=1, doclf=True)
>>> result = set_figtitle(figtitle='figtitle', fig=fig)
>>> # xdoc: +REQUIRES(--show)
>>> show_if_requested()

- graphid.util.mplutil.legend(loc='best', fontproperties=None, size=None, fc='w', alpha=1, ax=None, handles=None)[source]
- Parameters:
loc (str) – (default = ‘best’)
fontproperties (None) – (default = None)
size (None) – (default = None)
- graphid.util.mplutil.distinct_colors(N, brightness=0.878, randomize=True, hue_range=(0.0, 1.0), cmap_seed=None)[source]
- Parameters:
N (int)
brightness (float)
- Returns:
RGB_tuples
- Return type:
CommandLine
python -m color_funcs --test-distinct_colors --N 2 --show --hue-range=0.05,.95
python -m color_funcs --test-distinct_colors --N 3 --show --hue-range=0.05,.95
python -m color_funcs --test-distinct_colors --N 4 --show --hue-range=0.05,.95
python -m .color_funcs --test-distinct_colors --N 3 --show --no-randomize
python -m .color_funcs --test-distinct_colors --N 4 --show --no-randomize
python -m .color_funcs --test-distinct_colors --N 6 --show --no-randomize
python -m .color_funcs --test-distinct_colors --N 20 --show
References
http://blog.jianhuashao.com/2011/09/generate-n-distinct-colors.html
- graphid.util.mplutil.distinct_markers(num, style='astrisk', total=None, offset=0)[source]
- Parameters:
num (?)
- graphid.util.mplutil.deterministic_shuffle(list_, rng=0)[source]
-
Example
>>> list_ = [1, 2, 3, 4, 5, 6]
>>> seed = 1
>>> list_ = deterministic_shuffle(list_, seed)
>>> result = str(list_)
>>> print(result)
[3, 2, 5, 1, 4, 6]
- graphid.util.mplutil.show_if_requested(N=1)[source]
Used at the end of tests. Handles command line arguments for saving figures
- graphid.util.mplutil.save_parts(fig, fpath, grouped_axes=None, dpi=None)[source]
FIXME: this works in mpl 2.0.0, but not 2.0.2
- Parameters:
fig (?)
fpath (str) – file path string
dpi (None) – (default = None)
- Returns:
subpaths
- Return type:
CommandLine
python -m draw_func2 save_parts
- graphid.util.mplutil.imshow(img, fnum=None, title=None, figtitle=None, pnum=None, interpolation='nearest', cmap=None, heatmap=False, data_colorbar=False, xlabel=None, redraw_image=True, colorspace='bgr', ax=None, alpha=None, norm=None, **kwargs)[source]
- Parameters:
img (ndarray) – image data
fnum (int) – figure number
colorspace (str) – if the data is 3-4 channels, this indicates the colorspace 1 channel data is assumed grayscale. 4 channels assumes alpha.
title (str)
figtitle (None)
pnum (tuple) – plot number
interpolation (str) – other interpolations = nearest, bicubic, bilinear
cmap (None)
heatmap (bool)
data_colorbar (bool)
darken (None)
redraw_image (bool) – used when calling imshow over and over. if false doesnt do the image part.
- Returns:
(fig, ax)
- Return type:
- Kwargs:
docla, doclf, projection
- Returns:
(fig, ax)
- Return type:
- graphid.util.mplutil.colorbar(scalars, colors, custom=False, lbl=None, ticklabels=None, float_format='%.2f', **kwargs)[source]
adds a color bar next to the axes based on specific scalars
- Parameters:
scalars (ndarray)
colors (ndarray)
custom (bool) – use custom ticks
- Kwargs:
See plt.colorbar
- Returns:
matplotlib colorbar object
- Return type:
cb
- graphid.util.mplutil._get_plotdat(ax, key, default=None)[source]
returns internal property from a matplotlib axis
- graphid.util.mplutil._set_plotdat(ax, key, val)[source]
sets internal property to a matplotlib axis
- graphid.util.mplutil._ensure_divider(ax)[source]
Returns previously constructed divider or creates one
- graphid.util.mplutil.scores_to_color(score_list, cmap_='hot', logscale=False, reverse_cmap=False, custom=False, val2_customcolor=None, score_range=None, cmap_range=(0.1, 0.9))[source]
Other good colormaps are ‘spectral’, ‘gist_rainbow’, ‘gist_ncar’, ‘Set1’, ‘Set2’, ‘Accent’ # TODO: plasma
- Parameters:
score_list (list)
cmap_ (str) – defaults to hot
logscale (bool)
cmap_range (tuple) – restricts to only a portion of the cmap to avoid extremes
- Returns:
<class ‘_ast.ListComp’>
- graphid.util.mplutil.reverse_colormap(cmap)[source]
References
http://nbviewer.ipython.org/github/kwinkunks/notebooks/blob/master/Matteo_colourmaps.ipynb
- class graphid.util.mplutil.PlotNums(nRows=None, nCols=None, nSubplots=None, start=0)[source]
Bases:
objectConvinience class for dealing with plot numberings (pnums)
Example
>>> pnum_ = PlotNums(nRows=2, nCols=2)
>>> # Indexable
>>> print(pnum_[0])
(2, 2, 1)
>>> # Iterable
>>> print(ub.urepr(list(pnum_), nl=0, nobr=1))
(2, 2, 1), (2, 2, 2), (2, 2, 3), (2, 2, 4)
>>> # Callable (iterates through a default iterator)
>>> print(pnum_())
(2, 2, 1)
>>> print(pnum_())
(2, 2, 2)
- classmethod _get_num_rc(nSubplots=None, nRows=None, nCols=None)[source]
Gets a constrained row column plot grid
- Parameters:
nSubplots (None) – (default = None)
nRows (None) – (default = None)
nCols (None) – (default = None)
- Returns:
(nRows, nCols)
- Return type:
Example
>>> cases = [
>>>     dict(nRows=None, nCols=None, nSubplots=None),
>>>     dict(nRows=2, nCols=None, nSubplots=5),
>>>     dict(nRows=None, nCols=2, nSubplots=5),
>>>     dict(nRows=None, nCols=None, nSubplots=5),
>>> ]
>>> for kw in cases:
>>>     print('----')
>>>     size = PlotNums._get_num_rc(**kw)
>>>     if kw['nSubplots'] is not None:
>>>         assert size[0] * size[1] >= kw['nSubplots']
>>>     print('**kw = %s' % (ub.urepr(kw),))
>>>     print('size = %r' % (size,))
- _get_square_row_cols(max_cols=None, fix=False, inclusive=True)[source]
- Parameters:
nSubplots (int)
max_cols (int)
- Returns:
(int, int)
- Return type:
Example
>>> nSubplots = 9
>>> nSubplots_list = [1, 2, 3, 4, 5, 6, 7, 8, 9, 10, 11]
>>> max_cols = None
>>> rc_list = [PlotNums._get_square_row_cols(nSubplots, fix=True) for nSubplots in nSubplots_list]
>>> print(repr(np.array(rc_list).T))
array([[1, 1, 2, 2, 2, 2, 3, 3, 3, 3, 3],
       [1, 2, 2, 2, 3, 3, 3, 3, 3, 4, 4]])
- graphid.util.mplutil.draw_border(ax, color, lw=2, offset=None, adjust=True)[source]
draws rectangle border around a subplot
- graphid.util.mplutil.draw_boxes(boxes, box_format='xywh', color='blue', labels=None, textkw=None, ax=None)[source]
- Parameters:
boxes (list) – list of coordindates in xywh, tlbr, or cxywh format
box_format (str) – specify how boxes are formated xywh is the top left x and y pixel width and height cxywh is the center xy pixel width and height tlbr is the top left xy and the bottom right xy
color (str) – edge color of the boxes
labels (list) – if specified, plots a text annotation on each box
Example
>>> qtensure()  # xdoc: +SKIP
>>> bboxes = [[.1, .1, .6, .3], [.3, .5, .5, .6]]
>>> col = draw_boxes(bboxes)
- graphid.util.mplutil.draw_line_segments(pts1, pts2, ax=None, **kwargs)[source]
draws N line segments between N pairs of points
- Parameters:
pts1 (ndarray) – Nx2
pts2 (ndarray) – Nx2
ax (None) – (default = None)
**kwargs – lw, alpha, colors
Example
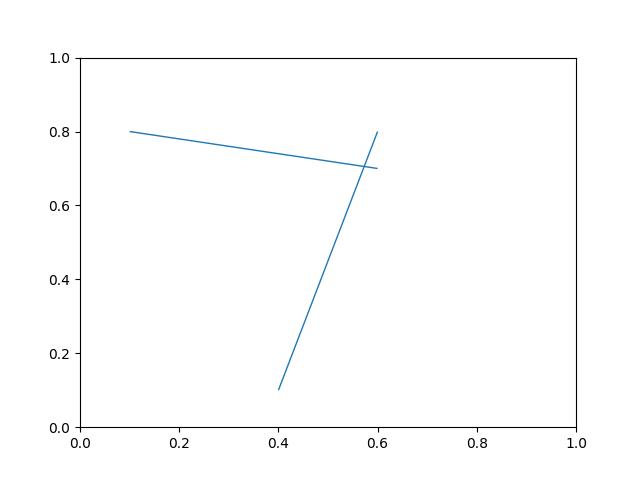
>>> pts1 = np.array([(.1, .8), (.6, .8)])
>>> pts2 = np.array([(.6, .7), (.4, .1)])
>>> figure(fnum=None)
>>> draw_line_segments(pts1, pts2)
>>> # xdoc: +REQUIRES(--show)
>>> import matplotlib.pyplot as plt
>>> ax = plt.gca()
>>> ax.set_xlim(0, 1)
>>> ax.set_ylim(0, 1)
>>> show_if_requested()

- graphid.util.mplutil.make_heatmask(probs, cmap='plasma', with_alpha=True)[source]
Colorizes a single-channel intensity mask (with an alpha channel)
- class graphid.util.mplutil.Color(color, alpha=None, space=None)[source]
Bases:
NiceReprmove to colorutil?
Example
>>> print(Color('g'))
>>> print(Color('orangered'))
>>> print(Color('#AAAAAA').as255())
>>> print(Color([0, 255, 0]))
>>> print(Color([1, 1, 1.]))
>>> print(Color([1, 1, 1]))
>>> print(Color(Color([1, 1, 1])).as255())
>>> print(Color(Color([1., 0, 1, 0])).ashex())
>>> print(Color([1, 1, 1], alpha=255))
>>> print(Color([1, 1, 1], alpha=255, space='lab'))
- classmethod _is_base255(channels)[source]
there is a one corner case where all pixels are 1 or less
- adjust_hsv(hue_adjust=0.0, sat_adjust=0.0, val_adjust=0.0)[source]
Performs adaptive changes to the HSV values of the color.
- Parameters:
hue_adjust (float) – addative
sat_adjust (float)
val_adjust (float)
- Returns:
new_rgb
- Return type:
CommandLine
python -m graphid.util.mplutil Color.adjust_hsv
Example
>>> rgb_list = [Color(c).as01() for c in ['pink', 'yellow', 'green']]
>>> hue_adjust = -0.1
>>> sat_adjust = +0.5
>>> val_adjust = -0.1
>>> # execute function
>>> new_rgb_list = [Color(rgb).adjust_hsv(hue_adjust, sat_adjust, val_adjust) for rgb in rgb_list]
>>> print(ub.urepr(new_rgb_list, nl=1, sv=True))
[
    <Color(rgb: 0.90, 0.23, 0.75)>,
    <Color(rgb: 0.90, 0.36, 0.00)>,
    <Color(rgb: 0.24, 0.40, 0.00)>,
]
>>> # xdoc: +REQUIRES(--show)
>>> color_list = rgb_list + new_rgb_list
>>> testshow_colors(color_list)
- graphid.util.mplutil.zoom_factory(ax=None, zoomable_list=[], base_scale=1.1)[source]
References
https://gist.github.com/tacaswell/3144287 http://stackoverflow.com/questions/11551049/matplotlib-plot-zooming-with-scroll-wheel
- graphid.util.mplutil.relative_text(pos, text, ax=None, offset=None, **kwargs)[source]
Places text on axes in a relative position
- Parameters:
pos (tuple) – relative xy position
text (str) – text
ax (None) – (default = None)
offset (None) – (default = None)
**kwargs – horizontalalignment, verticalalignment, roffset, ha, va, fontsize, fontproperties, fontproperties, clip_on
CommandLine
python -m graphid.util.mplutil relative_text --show
Example
>>> from graphid import util
>>> import matplotlib as mpl
>>> x = .5
>>> y = .5
>>> util.figure()
>>> txt = 'Hello World'
>>> family = 'monospace'
>>> family = 'CMU Typewriter Text'
>>> fontproperties = mpl.font_manager.FontProperties(family=family,
>>>                                                  size=42)
>>> relative_text((x, y), txt, halign='center',
>>>               fontproperties=fontproperties)
>>> util.show_if_requested()